 |
 |
 |
 |
 |
 |
 |
 |
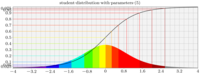 |
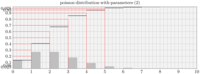
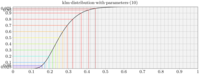
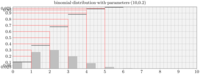
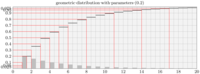
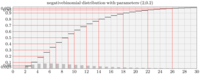
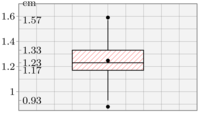
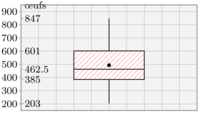
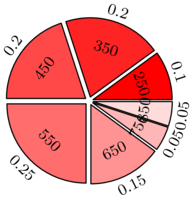
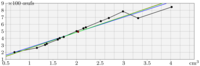
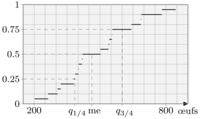
MetaPost is not really a suitable language for data analysis, but it is very fine for drawing graphs, and may be better than classical and expensive tools that output quite raw pictures.
Temporary remark. --- Last year I've received a mail about NA bug (I've lost the message). Things are not perfect about NA, but I've just tried (march 13, 2012) what has been sent to me: it seems to work.
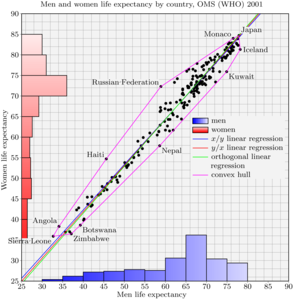
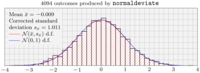
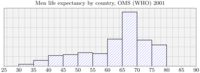
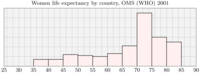
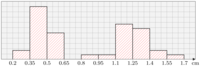
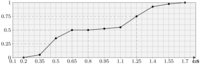
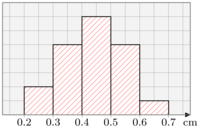
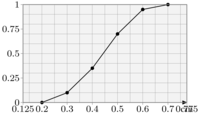
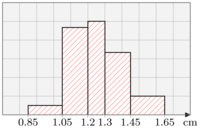
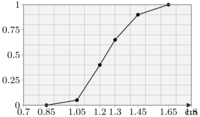
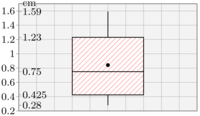
For instance the picture on the right shows life expectancy as reported by the OMS (WHO) for year 2001. It is based on the so-called healthy life expectancy (HALE). About 200 countries are represented here but they are not weightened in anyway (population size, etc.). So it is a quite naïve approach. Considering these data has been suggested by a colleague for an academic purpose: consider life expectancy for men, draw a histogram, make pointfull comments, make pointless manipulations, etc. Two dimensional plots are also very interesting: alignment of the data, extreme points of the convex hull. Another colleague gave be some explanations about the case of Russian Federation... So what do one has here: a scatter plot with the 3 usual regression lines, the convex hull, two histograms, graduations, titles and a legend. It provides already a lot of information.
I've made some figures for Probability and Statitical theories' lecture notes by the past, and the more I do, the more I try to make these automatical. Thus, a baby package is gonna emerge from that (in how many years?) which is a “mps” suite.
archive mps.tar.gz, manual (draft) statsman.pdf or better statsman.ps.gz (january 2011)
This stuff can progress if and only if I give lectures in statistics. Among the many things that I plan to do are: to introduce floating computations, to generalize the data format, to improve syntax, to unify algorithms and to extend to multivariate data plots, to write the manual, to use the special mathematical functions implemented in mps-maths.mp...
|
|
|
|
|
|
|
|
|
 |
 |
 |
 |
 |
 |
 |
 |
 |
 |
 |
 |
 |
 |
 |
 |
 |
 |
 |
 |
 |
 |